Using Sessions to manage models and data
So far we have discussed the object-based API of Sherpa -
where it is up to the user to manage the creation
and handling of
data,
model,
fit and related objects. Sherpa
also provides a “Session” class that handles much of this,
and it can be used
directly - via the sherpa.ui.utils.Session or
sherpa.astro.ui.utils.Session classes - or
indirectly using the routines in the
sherpa.ui and sherpa.astro.ui modules.
The session API is intended to be used in an interactive setting, and so deals with object management. Rather than deal with objects, the API uses labels (numeric or string) to identify data sets and model components. The Astronomy-specific version adds domain-specific functionality; in this case support for Astronomical data analysis, with a strong focus on high-energy (X-ray) data. It is currently documented on the https://cxc.harvard.edu/sherpa/ web site.
The Session object provides methods
that allow you to:
load data
set the model
change the statistic and optimiser
fit
calculate errors
visualize the results
These are the same stages as described in the getting started section, but the syntax is different, since the Session object handles the creation of, and passing around, the underlying Sherpa objects.
The sherpa.ui module provides an interface where
the Session object is hidden from the user, which makes it
more appropriate for an interactive analysis session.
Examples
The following examples are very basic, since they are intended to highlight how the Sesssion API is used. The CIAO documentation for Sherpa at https://cxc.harvard.edu/sherpa/ provides more documentation and examples.
There are two examples which show the same process -
finding out what value best represents a small dataset -
using the
Session object directly and then via the
sherpa.ui module.
The data to be fit is the four element array:
>>> x = [100, 200, 300, 400]
>>> y = [10, 12, 9, 13]
For this example the Cash statistic will
be used, along with the
NelderMead optimiser.
Note
Importing the Session object - whether directly or via the ui module - causes several checks to be run, to see what parts of the system may not be available. This can lead to warning messages such as the following to be displayed:
WARNING: imaging routines will not be available,
failed to import sherpa.image.ds9_backend due to
'RuntimeErr: DS9Win unusable: Could not find ds9 on your PATH'
Other checks are to see if the chosen I/O and plotting backends are present, and if support for the XSPEC model library is available.
Using the Session object
By default the Session object has no available models associated
with it. The
_add_model_types()
method is used to register the models from
sherpa.models.basic with the session (by default it will
add any class in the module that is derived from the
ArithmeticModel
class):
>>> from sherpa.ui.utils import Session
>>> import sherpa.models.basic
>>> s = Session()
>>> s._add_model_types(sherpa.models.basic)
The load_arrays() is used to
create a Data1D object, which is managed
by the Session class and referenced by the identifier 1
(this is in fact the default identifier, which can be
manipulated by the
get_default_id()
and
set_default_id()
methods, and can be a string or an integer).
Many methods will default to using the default identifier,
but load_arrays requires it:
>>> s.load_arrays(1, x, y)
Note
The session object is not just limited to handling
Data1D data sets. The
load_arrays takes an optional argument which defines
the class of the data (e.g. Data2D),
and there are several other methods which can be used to
create a data object, such as
load_data
and
set_data.
The list_data_ids() method
returns the list of available data sets (i.e. those that have
been loaded into the session):
>>> s.list_data_ids()
[1]
The get_data() method lets a user
access the underlying data object. This method uses the default
identifier if not specified:
>>> s.get_data()
<Data1D data set instance ''>
>>> print(s.get_data())
name      =
x         = Int64[4]
y         = Int64[4]
staterror = None
syserror  = None
The default statistic and optimiser are set to values useful for data with Gaussian errors:
>>> s.get_stat_name()
'chi2gehrels'
>>> s.get_method_name()
'levmar'
As the data here is counts based, and is to be fit with Poisson
statitics, the
set_stat()
and
set_method()
methods are used to change the statistic and optimiser.
Note that they take a string as an argument
(rather than an instance of a
Stat
or OptMethod
class):
>>> s.set_stat('cash')
>>> s.set_method('simplex')
The set_source() method is
used to define the model expression that is to be fit to the
data. It can be sent a model expression created using the
model classes directly, as described in the
Creating Model Instances section above.
However, in this case a string is used to define the model, and
references each model component using the form
modelname.instancename. The modelname defines the
type of model - in this case the
Const1D model - and it must
have been registered with the session object using
_add_model_types. The
list_models() method
can be used to find out what models are available.
The instancename is used as an identifier for the
component, and can be used with other methods,
such as set_par().
>>> s.set_source('const1d.mdl')
The instancename value is also used to create a Python variable
which provides direct access to the model component (it can
also be retrieved with
get_model_component()):
>>> print(mdl)
const1d.mdl
Param        Type          Value          Min          Max      Units
-----        ----          -----          ---          ---      -----
mdl.c0       thawed            1 -3.40282e+38  3.40282e+38
The source model can be retrievd with
get_source(), which in this
example is just the single model component mdl:
>>> s.get_source()
<Const1D model instance 'const1d.mdl'>
With the data, model, statistic, and optimiser set, it
is now possible to perform a fit. The
fit() method defaults to
a simultaneous fit of all the loaded data sets; in this case
there is only one:
>>> s.fit()
Dataset               = 1
Method                = neldermead
Statistic             = cash
Initial fit statistic = 8
Final fit statistic   = -123.015 at function evaluation 90
Data points           = 4
Degrees of freedom    = 3
Change in statistic   = 131.015
   mdl.c0         11
The fit results are displayed to the screen, but can also be accessed
with methods such as
calc_stat(),
calc_stat_info(),
and
get_fit_results().
>>> r = s.get_fit_results()
>>> print(r)
datasets       = (1,)
itermethodname = none
methodname     = neldermead
statname       = cash
succeeded      = True
parnames       = ('mdl.c0',)
parvals        = (11.0,)
statval        = -123.01478400625663
istatval       = 8.0
dstatval       = 131.01478400625663
numpoints      = 4
dof            = 3
qval           = None
rstat          = None
message        = Optimization terminated successfully
nfev           = 90
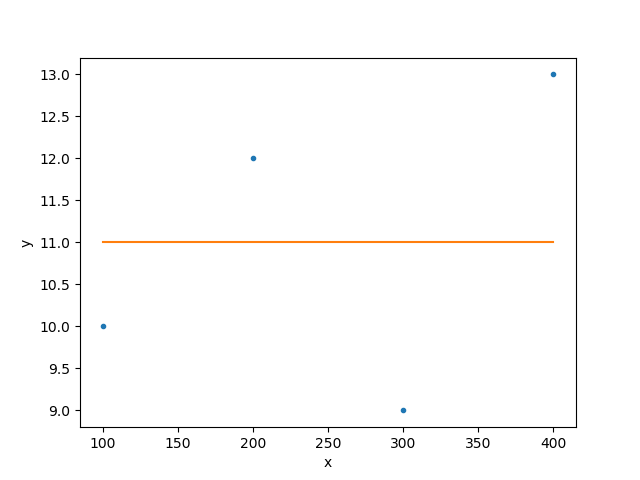
There are also methods which allow you to plot the data, model,
fit, and residuals (amongst others):
plot_data(),
plot_model(),
plot_fit(),
plot_resid().
The following
hides the automatically-created error bars on the data points
by changing a setting in dictionary returned by
get_data_plot_prefs(),
and then displays the data along with the model:
>>> s.get_data_plot_prefs()['yerrorbars'] = False
>>> s.plot_fit()
Using the UI module
Using the UI module is very similar to the Session object, since it automatically creates a global Session object, and registers the available models, when imported. This means that the preceeding example can be replicated but without the need for the Session object.
Since the module is intended for an interactive environment, in this example the symbols are loaded into the default namespace to avoid having to qualify each function with the module name. For commentary, please refer to the preceeding example:
>>> from sherpa.ui import *

>>> load_arrays(1, x, y)
>>> list_data_ids()
[1]

>>> get_data()
<Data1D data set instance ''>
>>> print(get_data())
name      =
x         = Int64[4]
y         = Int64[4]
staterror = None
syserror  = None

>>> get_stat_name()
'chi2gehrels'
>>> get_method_name()
'levmar'

>>> set_stat('cash')
>>> set_method('simplex')

>>> set_source('const1d.mdl')

>>> print(mdl)
const1d.mdl
Param        Type          Value          Min          Max      Units
-----        ----          -----          ---          ---      -----
mdl.c0       thawed            1 -3.40282e+38  3.40282e+38

>>> get_source()
<Const1D model instance 'const1d.mdl'>

>>> fit()
Dataset               = 1
Method                = neldermead
Statistic             = cash
Initial fit statistic = 8
Final fit statistic   = -123.015 at function evaluation 90
Data points           = 4
Degrees of freedom    = 3
Change in statistic   = 131.015
   mdl.c0         11

>>> r = get_fit_results()
>>> print(r)
datasets       = (1,)
itermethodname = none
methodname     = neldermead
statname       = cash
succeeded      = True
parnames       = ('mdl.c0',)
parvals        = (11.0,)
statval        = -123.01478400625663
istatval       = 8.0
dstatval       = 131.014784006
numpoints      = 4
dof            = 3
qval           = None
rstat          = None
message        = Optimization terminated successfully
nfev           = 90

>>> get_data_plot_prefs()['yerrorbars'] = False
>>> plot_fit()
The plot created by this function is the same as shown in the previous example.
Reference/API
- The sherpa.ui module
- add_model
- add_user_pars
- calc_chisqr
- calc_stat
- calc_stat_info
- clean
- conf
- confidence
- contour
- contour_data
- contour_fit
- contour_fit_resid
- contour_kernel
- contour_model
- contour_psf
- contour_ratio
- contour_resid
- contour_source
- copy_data
- covar
- covariance
- create_model_component
- dataspace1d
- dataspace2d
- delete_data
- delete_model
- delete_model_component
- delete_psf
- fake
- fit
- freeze
- get_cdf_plot
- get_chisqr_plot
- get_conf
- get_conf_opt
- get_conf_results
- get_confidence_results
- get_covar
- get_covar_opt
- get_covar_results
- get_covariance_results
- get_data
- get_data_contour
- get_data_contour_prefs
- get_data_image
- get_data_plot
- get_data_plot_prefs
- get_default_id
- get_delchi_plot
- get_dep
- get_dims
- get_draws
- get_error
- get_filter
- get_fit_contour
- get_fit_plot
- get_fit_results
- get_functions
- get_indep
- get_int_proj
- get_int_unc
- get_iter_method_name
- get_iter_method_opt
- get_kernel_contour
- get_kernel_image
- get_kernel_plot
- get_method
- get_method_name
- get_method_opt
- get_model
- get_model_autoassign_func
- get_model_component
- get_model_component_image
- get_model_component_plot
- get_model_contour
- get_model_contour_prefs
- get_model_image
- get_model_pars
- get_model_plot
- get_model_plot_prefs
- get_model_type
- get_num_par
- get_num_par_frozen
- get_num_par_thawed
- get_par
- get_pdf_plot
- get_prior
- get_proj
- get_proj_opt
- get_proj_results
- get_projection_results
- get_psf
- get_psf_contour
- get_psf_image
- get_psf_plot
- get_pvalue_plot
- get_pvalue_results
- get_ratio_contour
- get_ratio_image
- get_ratio_plot
- get_reg_proj
- get_reg_unc
- get_resid_contour
- get_resid_image
- get_resid_plot
- get_sampler
- get_sampler_name
- get_sampler_opt
- get_scatter_plot
- get_source
- get_source_component_image
- get_source_component_plot
- get_source_contour
- get_source_image
- get_source_plot
- get_split_plot
- get_stat
- get_stat_info
- get_stat_name
- get_staterror
- get_syserror
- get_trace_plot
- guess
- ignore
- ignore_id
- image_close
- image_data
- image_deleteframes
- image_fit
- image_getregion
- image_kernel
- image_model
- image_model_component
- image_open
- image_psf
- image_ratio
- image_resid
- image_setregion
- image_source
- image_source_component
- image_xpaget
- image_xpaset
- int_proj
- int_unc
- link
- list_data_ids
- list_functions
- list_iter_methods
- list_methods
- list_model_components
- list_model_ids
- list_models
- list_priors
- list_psf_ids
- list_samplers
- list_stats
- load_arrays
- load_conv
- load_data
- load_filter
- load_psf
- load_staterror
- load_syserror
- load_table_model
- load_template_interpolator
- load_template_model
- load_user_model
- load_user_stat
- normal_sample
- notice
- notice_id
- paramprompt
- plot
- plot_cdf
- plot_chisqr
- plot_data
- plot_delchi
- plot_fit
- plot_fit_delchi
- plot_fit_ratio
- plot_fit_resid
- plot_kernel
- plot_model
- plot_model_component
- plot_pdf
- plot_psf
- plot_pvalue
- plot_ratio
- plot_resid
- plot_scatter
- plot_source
- plot_source_component
- plot_trace
- proj
- projection
- reg_proj
- reg_unc
- reset
- restore
- save
- save_arrays
- save_data
- save_delchi
- save_error
- save_filter
- save_model
- save_resid
- save_source
- save_staterror
- save_syserror
- set_conf_opt
- set_covar_opt
- set_data
- set_default_id
- set_dep
- set_filter
- set_full_model
- set_iter_method
- set_iter_method_opt
- set_method
- set_method_opt
- set_model
- set_model_autoassign_func
- set_par
- set_prior
- set_proj_opt
- set_psf
- set_sampler
- set_sampler_opt
- set_source
- set_stat
- set_staterror
- set_syserror
- set_xlinear
- set_xlog
- set_ylinear
- set_ylog
- show_all
- show_conf
- show_covar
- show_data
- show_filter
- show_fit
- show_kernel
- show_method
- show_model
- show_proj
- show_psf
- show_source
- show_stat
- simulfit
- t_sample
- thaw
- uniform_sample
- unlink
- unpack_arrays
- unpack_data
- The sherpa.astro.ui module
- add_model
- add_user_pars
- calc_chisqr
- calc_data_sum
- calc_data_sum2d
- calc_energy_flux
- calc_kcorr
- calc_model_sum
- calc_model_sum2d
- calc_photon_flux
- calc_source_sum
- calc_source_sum2d
- calc_stat
- calc_stat_info
- clean
- conf
- confidence
- contour
- contour_data
- contour_fit
- contour_fit_resid
- contour_kernel
- contour_model
- contour_psf
- contour_ratio
- contour_resid
- contour_source
- copy_data
- covar
- covariance
- create_arf
- create_model_component
- create_rmf
- dataspace1d
- dataspace2d
- delete_bkg_model
- delete_data
- delete_model
- delete_model_component
- delete_pileup_model
- delete_psf
- eqwidth
- fake
- fake_pha
- fit
- fit_bkg
- freeze
- get_analysis
- get_areascal
- get_arf
- get_arf_plot
- get_axes
- get_backscal
- get_bkg
- get_bkg_arf
- get_bkg_chisqr_plot
- get_bkg_delchi_plot
- get_bkg_fit_plot
- get_bkg_model
- get_bkg_model_plot
- get_bkg_plot
- get_bkg_ratio_plot
- get_bkg_resid_plot
- get_bkg_rmf
- get_bkg_scale
- get_bkg_source
- get_bkg_source_plot
- get_cdf_plot
- get_chisqr_plot
- get_conf
- get_conf_opt
- get_conf_results
- get_confidence_results
- get_coord
- get_counts
- get_covar
- get_covar_opt
- get_covar_results
- get_covariance_results
- get_data
- get_data_contour
- get_data_contour_prefs
- get_data_image
- get_data_plot
- get_data_plot_prefs
- get_default_id
- get_delchi_plot
- get_dep
- get_dims
- get_draws
- get_energy_flux_hist
- get_error
- get_exposure
- get_filter
- get_fit_contour
- get_fit_plot
- get_fit_results
- get_functions
- get_grouping
- get_indep
- get_int_proj
- get_int_unc
- get_iter_method_name
- get_iter_method_opt
- get_kernel_contour
- get_kernel_image
- get_kernel_plot
- get_method
- get_method_name
- get_method_opt
- get_model
- get_model_autoassign_func
- get_model_component
- get_model_component_image
- get_model_component_plot
- get_model_contour
- get_model_contour_prefs
- get_model_image
- get_model_pars
- get_model_plot
- get_model_plot_prefs
- get_model_type
- get_num_par
- get_num_par_frozen
- get_num_par_thawed
- get_order_plot
- get_par
- get_pdf_plot
- get_photon_flux_hist
- get_pileup_model
- get_prior
- get_proj
- get_proj_opt
- get_proj_results
- get_projection_results
- get_psf
- get_psf_contour
- get_psf_image
- get_psf_plot
- get_pvalue_plot
- get_pvalue_results
- get_quality
- get_rate
- get_ratio_contour
- get_ratio_image
- get_ratio_plot
- get_reg_proj
- get_reg_unc
- get_resid_contour
- get_resid_image
- get_resid_plot
- get_response
- get_rmf
- get_sampler
- get_sampler_name
- get_sampler_opt
- get_scatter_plot
- get_source
- get_source_component_image
- get_source_component_plot
- get_source_contour
- get_source_image
- get_source_plot
- get_specresp
- get_split_plot
- get_stat
- get_stat_info
- get_stat_name
- get_staterror
- get_syserror
- get_trace_plot
- group
- group_adapt
- group_adapt_snr
- group_bins
- group_counts
- group_snr
- group_width
- guess
- ignore
- ignore2d
- ignore2d_id
- ignore2d_image
- ignore_bad
- ignore_id
- image_close
- image_data
- image_deleteframes
- image_fit
- image_getregion
- image_kernel
- image_model
- image_model_component
- image_open
- image_psf
- image_ratio
- image_resid
- image_setregion
- image_source
- image_source_component
- image_xpaget
- image_xpaset
- int_proj
- int_unc
- link
- list_bkg_ids
- list_data_ids
- list_functions
- list_iter_methods
- list_methods
- list_model_components
- list_model_ids
- list_models
- list_pileup_model_ids
- list_priors
- list_psf_ids
- list_response_ids
- list_samplers
- list_stats
- load_arf
- load_arrays
- load_ascii
- load_ascii_with_errors
- load_bkg
- load_bkg_arf
- load_bkg_rmf
- load_conv
- load_data
- load_filter
- load_grouping
- load_image
- load_multi_arfs
- load_multi_rmfs
- load_pha
- load_psf
- load_quality
- load_rmf
- load_staterror
- load_syserror
- load_table
- load_table_model
- load_template_interpolator
- load_template_model
- load_user_model
- load_user_stat
- load_xstable_model
- normal_sample
- notice
- notice2d
- notice2d_id
- notice2d_image
- notice_id
- pack_image
- pack_pha
- pack_table
- paramprompt
- plot
- plot_arf
- plot_bkg
- plot_bkg_chisqr
- plot_bkg_delchi
- plot_bkg_fit
- plot_bkg_fit_delchi
- plot_bkg_fit_ratio
- plot_bkg_fit_resid
- plot_bkg_model
- plot_bkg_ratio
- plot_bkg_resid
- plot_bkg_source
- plot_cdf
- plot_chisqr
- plot_data
- plot_delchi
- plot_energy_flux
- plot_fit
- plot_fit_delchi
- plot_fit_ratio
- plot_fit_resid
- plot_kernel
- plot_model
- plot_model_component
- plot_order
- plot_pdf
- plot_photon_flux
- plot_psf
- plot_pvalue
- plot_ratio
- plot_resid
- plot_scatter
- plot_source
- plot_source_component
- plot_trace
- proj
- projection
- reg_proj
- reg_unc
- resample_data
- reset
- restore
- sample_energy_flux
- sample_flux
- sample_photon_flux
- save
- save_all
- save_arrays
- save_data
- save_delchi
- save_error
- save_filter
- save_grouping
- save_image
- save_model
- save_pha
- save_quality
- save_resid
- save_source
- save_staterror
- save_syserror
- save_table
- set_analysis
- set_areascal
- set_arf
- set_backscal
- set_bkg
- set_bkg_full_model
- set_bkg_model
- set_bkg_source
- set_conf_opt
- set_coord
- set_counts
- set_covar_opt
- set_data
- set_default_id
- set_dep
- set_exposure
- set_filter
- set_full_model
- set_grouping
- set_iter_method
- set_iter_method_opt
- set_method
- set_method_opt
- set_model
- set_model_autoassign_func
- set_par
- set_pileup_model
- set_prior
- set_proj_opt
- set_psf
- set_quality
- set_rmf
- set_sampler
- set_sampler_opt
- set_source
- set_stat
- set_staterror
- set_syserror
- set_xlinear
- set_xlog
- set_ylinear
- set_ylog
- show_all
- show_bkg
- show_bkg_model
- show_bkg_source
- show_conf
- show_covar
- show_data
- show_filter
- show_fit
- show_kernel
- show_method
- show_model
- show_proj
- show_psf
- show_source
- show_stat
- simulfit
- subtract
- t_sample
- thaw
- ungroup
- uniform_sample
- unlink
- unpack_arf
- unpack_arrays
- unpack_ascii
- unpack_bkg
- unpack_data
- unpack_image
- unpack_pha
- unpack_rmf
- unpack_table
- unsubtract
- The sherpa.ui.utils module
- The sherpa.astro.ui.utils module